
Introduction
In order to manage more efficiently the control over human freshwater expenditure so one Dutch professor Arjen Hoekstra in 2002 coined the concept of water footprint. It is essential that dairy cattle consume adequate quantities of water each day to meet their requirements as water is required for digestion and metabolism of energy and nutrients, maintenance of proper ion, fluid and heat balance. Natural resources depletion is causing a significant threat to the sustainability of consumption. With transition in the nutrition, people are shifting towards more affluent food consumption patterns with more animal products. There has been a gradual shift of animal husbandry from subsistence to commercial nature.
Incidents of groundwater depletion, soil loss, land degradation, rivers running dry and increasing levels of pollution form an indication of the growing water scarcity. Dairy farming which is an integrated component of Indian farming system, involves not only direct consumptive water use as drinking and cleaning water for animals, but also indirect water embedded in feed.The food production today is by far the largest user of fresh water resources with 70 % compared with only 10 % for household use and 10 % for industry. Annually 70% of the used freshwater (not the total freshwater) goes to agriculture (FAO, 2014). In India about 64 percent of irrigated area relies on groundwater resources.
Water Footprint
Water footprint is the total volume of freshwater used to produce the goods and services consumed by the individual, business, or nation is known as the water footprint of an individual, business or nation (Chapagain 2007). Water footprint is an indicator of water use that looks at both direct and indirect water use by a consumer or producer(Hoekstra, 2003). The global WF of animal production constitutes almost one-third of the WF of total agricultural production. WF of milk in India is 1369 L/Kg while the world average is 990 L/kg(Hoekstra and Chapagain, 2007). The water footprint of milk can be calculated as:

The overall demand for water in livestock production is influenced by several factors such as type of animal, its activity, feed intake and diet, quality of available water, temperature of water, and ambient temperature. What kind of animal is used for production, where the animal is kept, what the animal diet constitutes of, where the feed is produced etc. will have an impact on the water requirement of the product. Livestock in itself contains between 5 and 20 times more virtual water per kg product than crop products. The increase in the consumption of animal products is likely to put further pressure on the world’s freshwater resources. Water footprint analysis can play an important role is ensuring sustainable agriculture and livestock products. The per capita water use in India will increase from the current level of 99 lit/day to 167 lit/day in 2050. 10% increase in cultivated land and a 20% increase in agricultural water demand will occur, even if we use optimum technology and productivity.
Components of Water Footprint
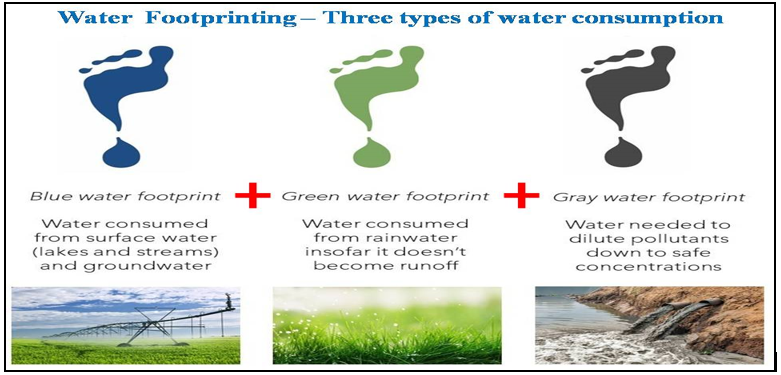
A water footprint is composed of three components:
- Green water footprint– Green WF is nothing but the precipitation on land that does not run off or it simply recharge the groundwater and is stored in the soil or temporary stay on top of the soil. Green water footprint includes precipitation and soil water absorbed by crop.
- Grey water footprint- The grey WF of a product is an indicator of freshwater pollution. It can be calculated as the volume of water that is required to dilute the pollutants to such a extend that the quality of water remains above agreed water quality standards.
- Blue water footprint- In case of agriculture and animal production system, Blue WF is basically the volume of water irrigated from various sources like groundwater, river, pond, etc. Blue WF is formed of Direct water, irrigation, groundwater, and surface water.
Water footprint of milk production includes two components namely
- Direct
- Indirect
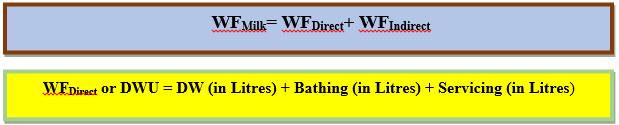
Where DWU is direct water use, DW is drinking water

Where DF is dry fodder, GF is green fodder, conc is concentrate
Water Footprint of Milk Production in India
India rank 1st in milk production and contributing 22% of the total world milk production with a growth of 6.65%.While in 2020 India will be 64.21% and 24.81% deficit in Green and dry respectively (IGFRI vision 2030). Singh and Avinash (2004) in the Gujarat dairy study of India have shown that the water productivity was as low as 0.3 L of milk per 1 m3 of water. The global water requirement for milk production is reported to be 1.1 per m3 of water, which is three times as high as in Gujarat. The total consumptive water uses for milk production in Karan fries, Murrah and Tharparker is 1212, 1269, and 1583 m³/ton. This is the inverse of their milk production (Karan Fries 9.0, Murrah 7.4, and Tharparker 7.2 kg/day). Murrah is less adaptive to climatic change because of its high water footprint per ton of milk production. Milk productivity and water footprint per unit milk yield is inversely correlated. Therefore, water consumed per kg of milk is relatively lesser in the case of a crossbred cow than buffalo and indigenous cattle due to their higher productivity. Higher the milk productivity of an animal the less will be its contribution to the water footprint.
The direct water footprint or blue water footprint in milk production varied from 9 m3 /ton to 11 m3 /ton in the organized sector and from 7.95 m3 /ton to 14.64 m3 /ton in the unorganized sector at Karnal. The total water footprints in the organized sector varied from around 1200-1600 m3 /ton of milk production and in the unorganized sector, it varied from 1550-2000 m3 /ton of milk production
Factors Affecting Water Footprints of Animal Products
From total water used for milk production from buffalo, crossbred cows,s and indigenous cows, the share of drinking water is less than 1 %, while embedded water accounts for the rest(Singh et al., 2004). Main factors involved in WF of milk are:
- Feed conversion efficiencies– FCE is the total amount of feed required to produce one unit of animal product and it strongly affects the WF. Cattle relatively have low conversion efficiency that’s why it has large WF. In the case of chicken and pig, they have a large fraction of cereals and oils meals in their feed which results in relatively larger WF.
- Feed composition and Feed origin- Feed constitute 98%, drinking 1.1%, service water 0.8%, and feed mixing water 0.03% of the total WF. In general, concentrates have a larger WF than roughage. The total mixture of roughages (grass, crop residues, and fodder crops) has a WF of around 200 m³/tonne (global average); this is about 1000 m³/tonne for the package of ingredients contained in concentrates.
Conclusion
Water footprint can act as a tool for sustainable dairy farming which can be used to calculate water in milk production. It can be mainly reduced by reducing water use for crop production as it is the major indirect component. High crop productivity (irrigation method like drip and sprinkler, precision land leveling, mulches), low water consuming high nutrition value feed crops, suitable feeding patterns, water saving techniques (water budget, using waste wash water for collecting yards wash down, roof water collection) and increasing milk productivity by shifting to greater-volume producing cows may allow the production of milk in a more water sustainable way, reducing its water footprint. Proper management strategies are highly essential for sustaining the livestock production systems.

Aditya Chandrakar
M.V.Sc Scholar, Livestock Production Management, ICAR-NDRI
Karnal, Haryana

Nripendra Pratap Singh
Ph.D. Scholar, Livestock Production Management, ICAR-NDRI, Karnal, Haryana


 A Global Threat to Livestock and Agriculture")